Screen. Detect. Treat. Monitor.

Blood-RNA digital twins for earlier cancer detection and smarter treatment monitoring.

We are developing an AI-driven liquid-biopsy platform that reads RNA signals from platelets, immune cells and extracellular material to support earlier cancer detection, treatment-response monitoring and patient-level molecular digital twins.

5,000
Participants in our Phase 1 programme
8
Common cancers under clinical validation
3
Products across the cancer-care continuum
1
Research API, live on Google Cloud Marketplace

Screen.

Non-invasive, affordable and scalable methods to expand cancer screening globally.

Detect.

Profiling rare molecular events in blood with a high-performing AI system deployable in low-income countries.

Treat.

Many cancers are treatable if detected early. We provide data products that aid clinicians in treatment decisions.

Monitor.

Our AI detects and monitors drug resistance to predict and prevent relapse across multiple cancers.

The platform

From a blood sample to a molecular digital twin.

CCANED-CIPHER is designed to generate one of the most clinically relevant blood-RNA datasets for cancer detection and treatment-response monitoring. By combining platelet RNA, immune-cell RNA, extracellular RNA and clinical metadata, we are building the foundation for DiNanoTwin: a patient-level molecular digital twin designed to model cancer state, treatment response and disease trajectory over time.

01

Sample.

A standard blood draw and structured clinical metadata.

02

Profile.

RNA signals from platelets, immune cells and extracellular material.

03

Model.

AI systems that learn cancer-associated patterns, monitor longitudinal change and power molecular digital twins.

A family with a clinician in a care setting
Approach

Designed to move beyond mutation-only liquid biopsy.

Many liquid-biopsy approaches focus on tumour DNA, which can be difficult to detect in early disease. Our system profiles blood-RNA signals shaped by tumour–host interactions, using AI to identify patterns that may appear before conventional markers are clinically obvious.

Explore the platform
Liquid biopsy, reimagined

Platelets as biosensors.

Conventional ctDNA approaches often fail in early-stage disease, where tumour fractions are vanishingly low. Our platform instead reads tumour-educated platelets, which act as active biological concentrators of tumour-secreted signals, giving high sampling coverage across hepatocellular carcinoma and non-small cell lung cancer.

Tumours communicate with the immune system, platelets and extracellular vesicles, and these interactions can alter circulating RNA profiles. Liquid-biopsy research increasingly recognises tumour-educated platelets, extracellular vesicles and circulating RNA as complementary biomarker sources alongside ctDNA.

≈ 400 bn
Platelets per litre of circulation, sampled from a standard blood draw, each one a potential reporter of tumour biology.
circRNA
Covalently closed loops, ~3× more stable than linear RNA.
A-to-I
RNA-editing events catalysed by ADAR enzymes.
What we measure

Two hyper-stable signals, one minimal panel.

We deliberately target signal classes that survive platelet RNA degradation, enriching for robust, manufacturable features rather than fragile ones.

Signal class 01

Circular RNAs.

Covalently closed loops, roughly three times more stable than their linear counterparts thanks to exonuclease resistance. Their durability lets them persist where conventional transcripts degrade.

Signal class 02

A-to-I RNA editing.

Editing events catalysed by ADAR enzymes. In HCC, ADAR1 over-expression drives hyper-editing in oncogenesis- and immune-evasion-linked transcripts; analogous post-transcriptional signatures support NSCLC.

Representation layer · Research Use Only

Two biological axes, kept separate.

Rather than collapsing everything into a single cancer-versus-control score, our model defines distinct biological axes and keeps them apart, so host biology and tumour biology can be read separately and interpreted rather than blurred together.

Axis 01

Host-immune axis

Immune, platelet, inflammatory and vascular signals read from a routine blood draw: the host's response to disease, and the axis DiNanoTrack is built on.

Axis 02

Tumour-space axis

Cancer-type structure, recovered by aligning blood-derived signals to tumour-type biology so a sample can be placed in clinically meaningful context.

Axis 03 · downstream

Pharmacology axis

Downstream of the tumour axis, it retrieves published research evidence for hypothesis generation only, never patient-specific drug sensitivity or treatment recommendations.

Consistent across samples
The model is built to reduce site and batch differences, so blood-derived samples are interpreted consistently over time and can be compared against tumour-type biology.
DiNanoTwin · molecular digital twin

Risk, evaluated at the moment a decision is needed.

Most clinical AI assumes evenly spaced visits. Real clinics are irregular, and the time since the last scan is itself a risk modifier. DiNanoTwin is built to be time-aware: it reads risk at the exact moment a decision is needed and interpolates between irregular visits, rather than forcing patients onto a fixed schedule.

Research Use Only. The platform makes no claim of diagnosis, tissue-of-origin prediction, treatment response, prognosis or survival risk without a locked validation package. The pharmacology axis returns research associations for hypothesis generation only. AI augments clinical judgement; it does not replace it.

Our products

From a single blood draw to a continuum of care.

Two clinical dashboards and a molecular-twin platform span the journey: detecting cancer early, monitoring treatment response, and surveilling risk across a patient's lifetime.

DiNanoQ®.

Detect
Early cancer diagnostics

DiNanoQ is our early-detection model family, designed to identify cancer-associated RNA patterns and estimate likely tissue of origin from blood-derived transcriptomic profiles.

Learn more →
Investigational

DiNanoTwin®.

Platform
Clinician-mediated molecular twin

DiNanoTwin integrates detection and monitoring outputs into a dynamic molecular representation of the patient's disease state, designed to support future clinical decision-support applications after validation and regulatory clearance.

Learn more →

DiNanoTrack®.

Monitor
Treatment-response monitoring

DiNanoTrack is our longitudinal monitoring model family, designed to study how blood-RNA signals change during therapy and whether those changes correlate with response, resistance or relapse risk.

Learn more →
The molecular twin

One platform. Standard blood draws. Three clinical use cases.

DiNanoTwin reads dynamic host-response signals from a routine blood draw and models how they change over time, supporting clinicians across the cancer journey.

Our models are being developed to prioritise reproducibility, interpretability and clinical usability, producing not just a classification but clinician-facing molecular insight (confidence scores, feature-level explanations, longitudinal change and similarity to clinically relevant patient subgroups).

01

Earlier detection.

Surfacing cancer-associated biology before symptoms, from a standard blood draw.

02

At-risk surveillance.

Longitudinal monitoring for high-risk adults, tracking molecular change over time.

03

Treatment-response monitoring.

Detecting drug resistance and relapse biology at baseline, six weeks and six months.

Developer platform RESEARCH USE ONLY

DYSPLAI.

Molecular oncology intelligence, from sequence to signed report: one API.

DYSPLAI packages the entire molecular research workflow (analysis, cohort statistics, explainable evidence, reporting and more) into a single, secure, multi-tenant product that research teams can deploy instead of build.

{{ marketplaceCta }} Request a demo Coming soon to Google Cloud Marketplace
submit_analysis.sh
# one gateway is the only ingress
POST $DYSPLAI_BASE_URL/v1/analyses
X-Api-Key: $DYSPLAI_API_KEY

{
  "sample_id": "cohort-07",
  "input_type": "fastq",
  "input_uri": "gs://your-tenant/reads/…_R1.fastq.gz",
  "atlas_version": "v1.0.0"
}
202 Accepted async · returns in ms
{
  "analysis_id": "an_9f3c…",
  "status": "queued",
  "ruo_disclaimer": "For Research Use Only."
}
The reference atlas

Positioning every sample in context.

DYSPLAI spans 17 cancer types in a single molecular reference atlas, giving every sample instant biological context: nearest neighbours, representativeness, and out-of-distribution flags as standard.

Its cross-domain engine unlocks the archive: analyse historic biobank specimens alongside fresh material, and issue callbacks that re-surface stored cohorts as the atlas grows. And because it positions each profile in survival-associated molecular space, DYSPLAI makes exceptional responders and non-responders discoverable and directly comparable, turning outlier biology into a research hypothesis you can explore.

Molecular context, on demand.

GET /v1/analyses/{id}/results
{
  "cancer_type_probabilities": { "LUAD": 0.71, "LUSC": 0.14, "…": 0.15 },
  "cancer_type_confidence": 0.71,
  "cin_score": 0.38,
  "immune_phenotype": "inflamed",
  "immune_phenotype_probability": 0.68,
  "pathway_scores": { "glycolysis": 0.42, "hypoxia": 0.31, "…": -0.12 },
  "host_immune_score": 0.88,
  "tumour_score": 0.81,
  "discordance_delta": 0.07,
  "discordance_interpretation": "Host-immune and tumour-space axes broadly agree for this sample.",
  "atlas_representativeness_score": 0.62,
  "atlas_out_of_distribution": false,
  "biological_neighbourhood_description": "nearest survival-associated reference region (research context only)",
  "ruo_disclaimer": "For Research Use Only. Not for use in diagnostic procedures."
}
A complete service portfolio

One gateway, the whole workflow.

Purpose-built, independently scalable services behind a single authenticated gateway (from raw sequence to a signed, reproducible report).

Analysis

Asynchronous, QC-gated processing of molecular inputs, returning a sample's position in the reference atlas with per-sample provenance.

Cohort

Summarise, compare and neighbour-search across analyses, with guards that only truly comparable samples are pooled.

Graph · Explainable AI

Prediction-grounded structured evidence and an interactive molecular-network view. Transparency, not a black box.

Interpretation · OncoLLM

Synthesises findings into readable, cited narrative, with guardrails that refuse diagnostic, prognostic or treatment-intent queries.

Reports

Publication-quality PDF and JSON reports with executive summaries and reproducible provenance.

…and many more

A growing portfolio of research services, all behind the same authenticated gateway.

Graph · Explainable AI

Not a score. A case file.

DYSPLAI's molecular evidence graph grounds each result in the biology behind it: it links the prediction to supporting and contradicting pathway activity, gene expression, and the post-transcriptional layer other atlases skip (circRNA back-splice junctions, alternative-splice events and RNA modifications), each backed by public reference priors and the nearest atlas neighbours.

Because it surfaces contradicting evidence too, you see how well-supported a call is: coverage, direction and priors, never a black-box number.

A molecular evidence graph at scale
68M+
Evidence relationships
9M+
Graph nodes
37,000+
Reference samples across 17 cancer types
1.5M
circRNA back-splice junctions
40,000+
Alternative-splice events
2.8M+
RNA modification observations

Explainable by construction: pathways, gene expression, circRNA junctions, splice events, RNA edits and clinical metrics, fused into one navigable evidence graph per sample.

Model performance

Grounded and honest about it.

The representation is decomposed into three axes (host-immune response, tumour atlas, and pharmacology), each auditable on its own held-out split.

Metric
Host-immune
Tumour atlas
Pharmacology
Condition accuracy
0.976
0.974
0.983
Condition AUROC
0.983
0.975
0.969
Cancer-Type accuracy
0.950
0.915
0.910
Condition Brier
0.046
0.049
0.031
Condition ECE
0.023
0.023
0.015
Condition MCE
0.021
0.361
0.013

Internal held-out (validation) split; condition probabilities are well-calibrated (Brier ≈ 0.03–0.05).

Pathway Counterfactual Explorer

What if a pathway moved?

A research tool for local molecular sensitivity: it explores how a profile moves toward a survival-associated neighbourhood, phrased as "locally associated with," never as an intervention.

Every response ships a validity_panel and conservative perturbation bounds, so you always see how far to trust the result, or when not to.

validity_panel
local_neighbourhood_size200 local_density0.74 surrogate_r_squared_pfi0.81 bootstrap_stability0.86 perturbation_classificationconservative out_of_distributionfalse interpretation_statusreliable
Built for sensitive data at commercial scale

Intelligence brought to your data.

Hard tenant isolation

Every query, artefact and result is scoped to its owner and namespaced against identifier-guessing (IDOR). Cross-tenant access is explicitly tested and denied.

Confidential compute

Inference runs on memory-encrypted GKE Confidential Compute: molecular data is encrypted in use, not only at rest and in transit. A bring-your-own-environment tier keeps compute and data entirely inside your own estate.

Research integrity by design

No fabricated data, ever. QC failures, low-confidence estimates and out-of-distribution samples are surfaced honestly, not hidden.

Marketplace-ready

Available via Google Cloud Marketplace with tiered, usage-based billing; procurement-ready through existing cloud agreements.

Runs on Google Cloud. Confidential GKE Autopilot, regional data residency (UK / EU / US) and Marketplace billing; engineered with Google Cloud and NVIDIA Inception.
Usage-based pricing

Results from as little as ~£4 per usage credit; end-to-end sample characterisation for as little as £80.

{{ marketplaceCta }} Coming soon to Google Cloud Marketplace

Research Use Only. Not for use in diagnostic procedures. DYSPLAI is not a diagnostic, treatment-recommendation or clinical-decision-support system, and is not an EHR or LIMS. The ruo_disclaimer field is non-suppressible on every response containing molecular, cohort, counterfactual, interpretation or report data. Customers must de-identify data before submission.

Clinical trials

CCANED CIPHER.

Our clinical programme runs 2025 to 2027 across two linked arms: CCANED, a population-scale early-detection cohort, and CIPHER, a treatment-monitoring backbone. Delivered through a global network of partners across several countries, to generate diverse and longitudinal data, turning single snapshots into molecular trajectories.

Every timepoint feeds a continuously learning molecular twin of each participant's cancer biology, powering the platform's next generation: DiNanoQ for earlier detection and DiNanoTrack for surveillance and monitoring. As the cohort grows, the twins sharpen and the evidence behind both compounds.

Explore the study on ClinicalTrials.gov ↗
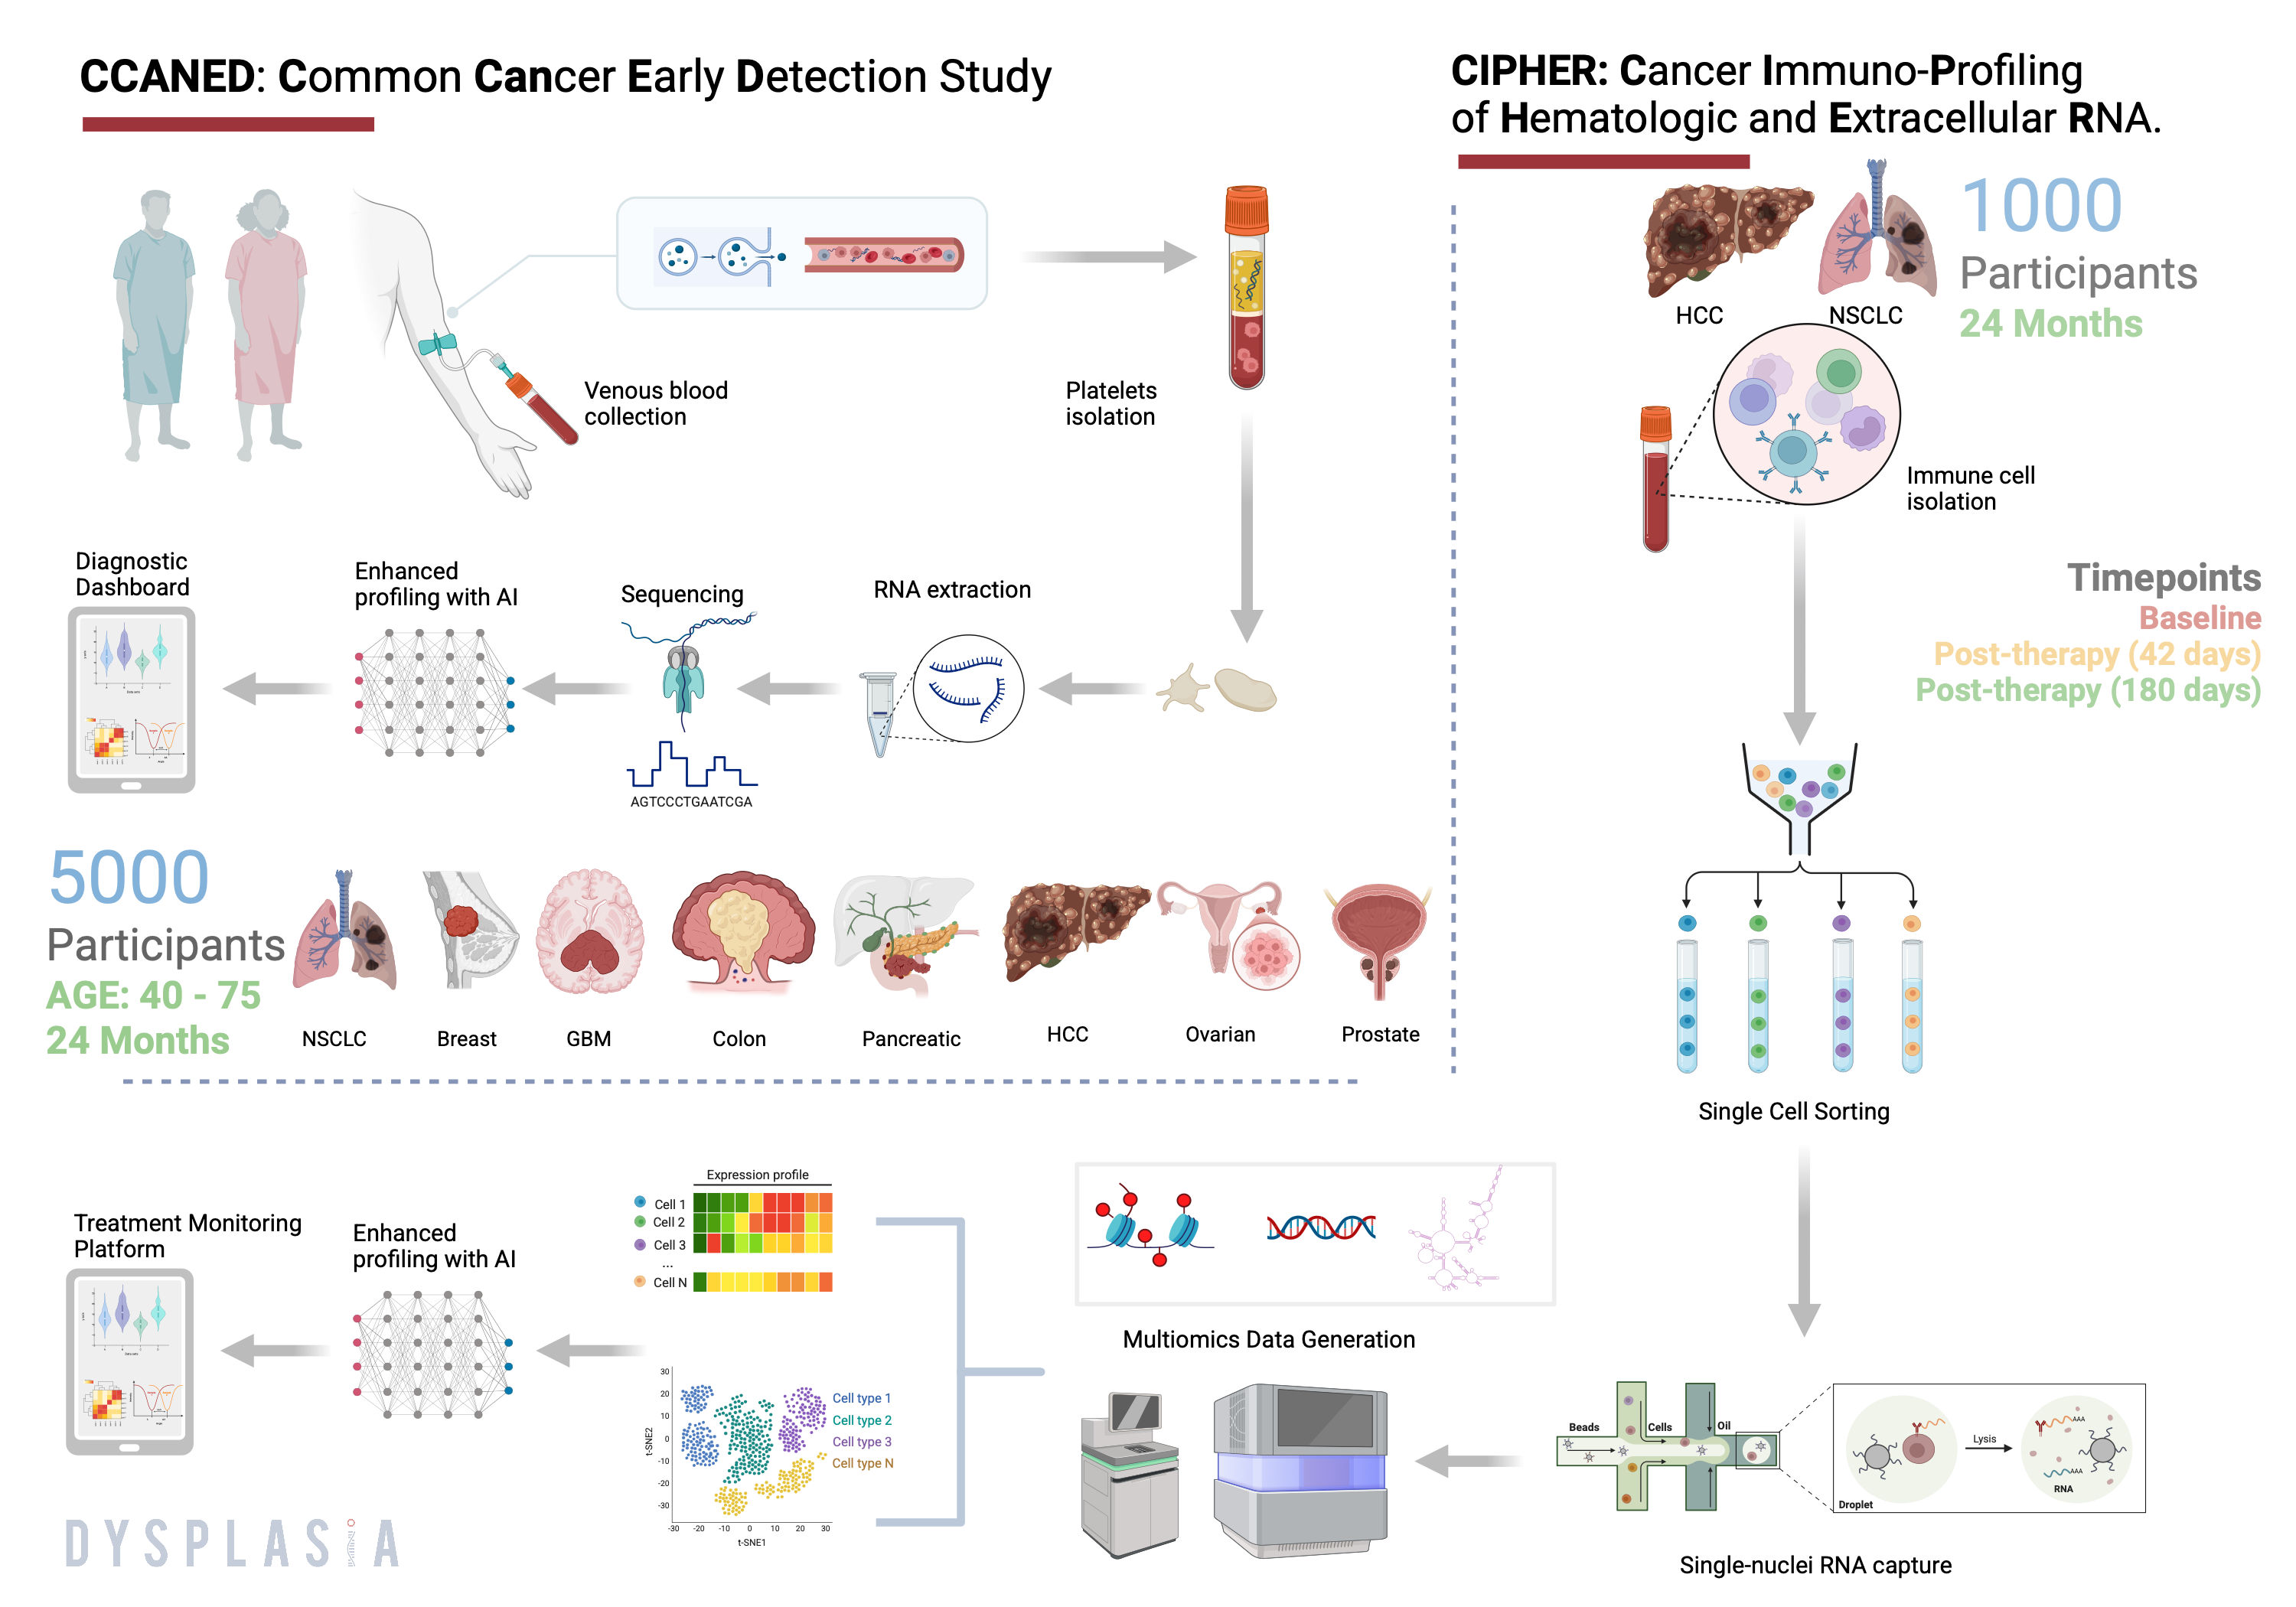
CCANED-CIPHER study design: venous blood collection, platelet and immune-cell RNA profiling, AI-enhanced analysis feeding the diagnostic and treatment-monitoring platforms, across 5,000 early-detection and 1,000 treatment-monitoring participants
ARM 01 Early detection

CCANED.

Common Cancer Early Detection
5,000 participants 8 cancers

A population-scale early-detection cohort generating the validation data behind DiNanoQ for non-invasive cancer detection.

ARM 02 Treatment monitoring

CIPHER.

Cancer Immuno-Profiling of Hematologic and Extracellular RNA
1,000 participants HCC + NSCLC

A focused monitoring cohort that anchors a named molecular digital-twin programme in NSCLC, reading treatment response at baseline, six weeks and six months to surface drug resistance and relapse biology.
Eight common cancers under investigation Registered · NCT06717295 ↗
Non-Small Cell Lung Cancer NSCLC Glioblastoma Multiforme GBM Colorectal Cancer Hepatocellular Carcinoma HCC Breast Cancer Prostate Cancer Ovarian Cancer Pancreatic Cancer
Key scientists
Prof. Solomon Rotimi
Head of Research and Clinical Outreach
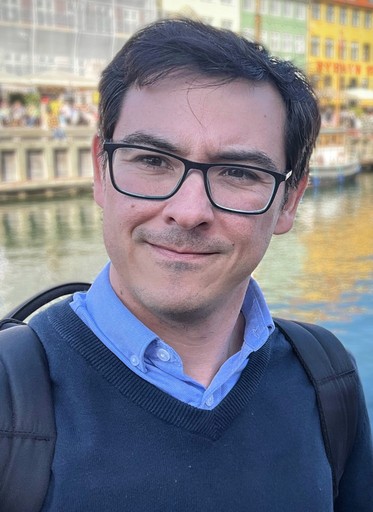
Dr. Javier Toledo
Dr. Javier Toledo
Chief Medical Officer
Dr. Osagie Izuogu
Dr. Osagie Izuogu
Head of AI and Bioinformatics
Dr. Dimitris Polychronopoulos
Scientific Advisor
Illustration of people holding hands in a spiral
Careers

Join us in shaping the future of healthcare with groundbreaking innovations that save lives.

We are on the lookout for dedicated professionals who can help us in our mission to improve cancer diagnostics and treatment management.

Speculative applications

A new challenge, and a chance to beat cancer.

Send a speculative CV over to careers@dysplasiadx.com if you're looking for a new challenge and a chance to be a part of our efforts to beat cancer.

Send your CV

Screen. Detect. Treat. Monitor.